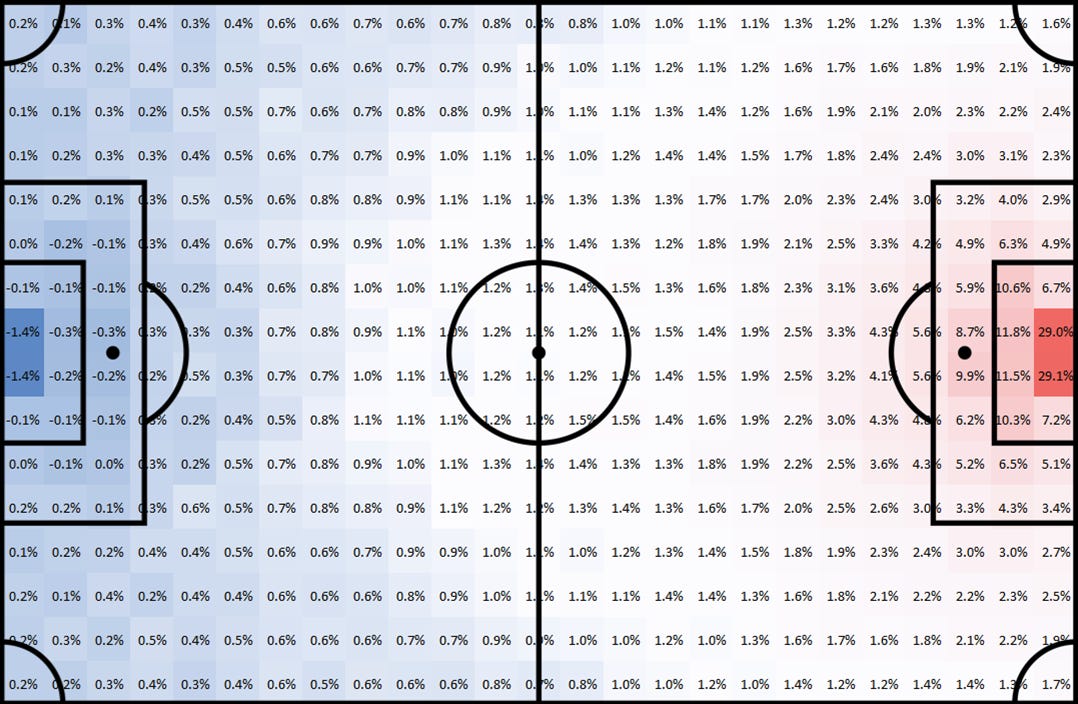
Football has always been a game of emotions — moments of brilliance, heartbreak, and luck. But in the data-driven era, emotion alone no longer defines the narrative. Modern analysis demands precision. Enter Expected Goals (xG) — a statistical revolution that reshaped how we understand performance, efficiency, and even luck itself.
For some, xG is the holy grail of football analytics; for others, it’s a complex abstraction. In truth, it’s both science and art — a tool that doesn’t predict outcomes, but rather explains the story behind them.
What Exactly Is xG?
Expected Goals (xG) measures the quality of scoring chances rather than their quantity. Every shot in a match is assigned a value — from 0 to 1 — indicating the probability of that shot resulting in a goal, based on thousands of similar attempts in historical data.
For example:
- A penalty kick has an xG of around 0.76 (meaning roughly 76% of penalties result in goals).
- A long-range effort outside the box might have an xG of 0.03.
- A close-range header? Perhaps 0.25.
Summed up across a game or a season, xG offers a quantitative look at how well a team creates or concedes chances — independent of luck or finishing ability.
What xG Reveals (and What It Doesn’t)
The beauty of xG is that it cuts through randomness. A team may win 1–0 but create chances worth 0.5 xG — suggesting they were lucky. Another team might lose 0–1 despite generating 2.3 xG — meaning they dominated but lacked clinical finishing.
xG reveals:
- Chance quality — how dangerous a team’s opportunities truly are.
- Consistency of performance — even during poor scoring spells.
- Sustainability of form — whether success is repeatable or driven by variance.
However, xG doesn’t capture everything. It can’t measure game context, player confidence, defensive errors, or tactical decisions. It doesn’t account for elite finishers — players like Erling Haaland or Mohamed Salah, who consistently outperform xG because their precision defies statistical norms.
How Analysts and Coaches Use It?
In modern clubs, xG is more than a number on a post-match graph — it’s an internal benchmark for performance assessment.
- Coaches use xG to evaluate tactical plans: Did our positioning produce high-quality shots?
- Analysts track cumulative xG over time to identify overperforming or underperforming teams.
- Recruiters use xG and related metrics (xA — expected assists, xT — expected threat) to find undervalued players.
- Data firms like Opta, StatsBomb, and Wyscout refine models with machine learning, analyzing shot angles, defensive pressure, and pass sequences.
At elite levels, xG is part of a broader ecosystem — a digital twin of the game itself.
When Numbers Challenge Narrative?
xG often debunks myths. Take Leicester City’s 2015–16 Premier League triumph: the club significantly outperformed its xG throughout the season. Analysts saw it as proof that, while xG measures probability, football still allows room for miracles. Similarly, Manchester City under Pep Guardiola often underperform on scorelines compared to xG, simply because their approach prioritizes control and volume — they win on process, not chaos. On the flip side, clubs that consistently outperform xG year after year — like Liverpool under Klopp or Real Madrid under Ancelotti — prove that elite finishing and psychological resilience can turn probability into mastery.
The Broader Impact of xG on Modern Football
The introduction of xG changed how fans, pundits, and professionals debate the game. It shifted the focus from outcome-based analysis (“Who won?”) to process-based understanding (“Who deserved to win?”).
It also reshaped betting, fantasy football, and club strategy:
- Smart bettors now monitor xG trends to predict regression or overperformance.
- Fantasy managers rely on xG to spot players who are “due” for goals.
- Clubs use rolling xG averages to detect when results deviate from performance.
xG doesn’t eliminate the romance of football — it refines it. It helps us distinguish between skill and serendipity.
Why It Matters?
In a sport often ruled by passion, xG brings accountability. It’s a reminder that dominance isn’t always visible on the scoreboard, and that luck, for all its charm, eventually balances out. For analysts, it’s a compass. For coaches, it’s feedback. For fans, it’s a new lens — one that deepens appreciation for the game’s tactical depth. Football will always remain unpredictable. But with xG, we can finally quantify how fair the chaos really is.
Typical xG Values in Football Situations
| Situation | Example Scenario | Average xG Value | Notes |
| Penalty Kick | One-on-one from 11 meters | 0.76 | Roughly 3 out of 4 penalties are scored |
| Close-Range Shot (6-yard box) | Low cross or rebound | 0.45–0.60 | High-quality chance, often expected to score |
| Header (inside box) | Cross from the wing | 0.20–0.30 | Lower conversion rate due to accuracy difficulty |
| Shot from Edge of Box | Long-range attempt | 0.07–0.10 | Only 1 in 10 such shots usually results in goal |
| Free Kick (direct) | From 20–25 meters | 0.05–0.08 | Difficult to convert; technique-dependent |
| Fast Counterattack | 2v1 or 3v2 breakaway | 0.35–0.50 | Often higher xG because of open space |
| Long Shot (30+ meters) | Striker tries from distance | 0.02–0.03 | Rarely successful; mostly speculative |


Laisser un commentaire